To do advanced statistics in excel you have to make sure that Analysis Toolpak Add-in is installed. Assuming that it is not installed,the following needs to be done;
- Run Microsoft Office Setup to add components to MS Office
- Select Analysis Toolpak under the Excel group of software items.
Once this is done
- Run Excel
- Select Addins in the tool menu. ( In EXCEL 2007 Add-ins tab is in the excel option dialogue box)
- In the dialogue box select Analysis Toolpak and then click on the OK button.
Now you have an extra command, Data analysis on the Tools Menu and you can do the statistics.
ANOVA
Type your data into blank spread sheet.
Now select the data analysis command on the tools menu (Data menu in excel 2007). This will give you dialogue box as shown below, listing all the data analysis facilities that are available.
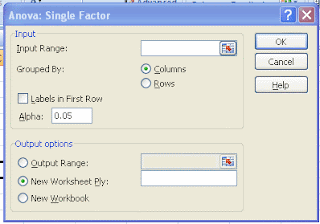
Select Anova: Single Factor and clickon the OK button. This will give you a dialogue box full of options.
Place the cursor in the input range control and then use the mouse to select on the spreadsheet the data you want to analyse. This should enter the appropriate cell reference in the control.
Depending upon whether the data is grouped as columns or Rows click on the appropriate values.
Label in first row check box tells the tool to use the labels in the top row of the data to label some of the statistical values. If you haven’t used labels leave this unticked.
Alpha refers to critical probability . It makes hardly any difference to the analysis Simply adds to the table of results f statistics.
Select the new worksheet ply and type in appropriate label.
Click on the OK button.
Excel will do all the calculation and present the results in a new ply.
Summary in the table represents summary statistics separately for each column. Following this is table labeled Anova that contains figures used for the significance test.
The P value in the Anova table above which contains the probability that the three column means are due only to random variation is important for coming up with a final conclusion. All the values are intermediate statistics. In single factor Anova the variation categorized into different source. So there is variation owing to imprecision within the group and between the groups.
Between groups
This is the variation between group means. The first step is the sums of squares of deviation of group means from the overall mean (SS=0.0144). Further the table show mean squares (MS=0.00722) which is the sum of squares divided by degrees of freedom (df=2).
Within groups.
This is the variation within group. The sums of squares values is simply the total for each of the individual block sums of squared deviations (SS=0.676).Mean square (MS=0.045) is the sums of squares divided by degrees of freedom (df=15).
Total
Is the sum of squares values that you already have.
f statistic
This is the mean square ration of ‘between’ to ‘within’. If f is big then variation between groups is high compared with within groups. An f value of 1.0 is expected if there is no significant difference between group means.
P Value
This is the probability that the f value could have occurred because of random variation in the replicates. If P is below s chosen threshold (often 0.05), then you accept that there is different accuracy occurring between different sets of measurement . In the above test P = 0.85 which is greater than 0.05 so there is no significant difference between groups.
F crit
This is the critical f value. It is the f value that would give a P value of 0.05.


0 comments:
Post a Comment